A recent study published by James Fowler and his fellow scientists at the University of California San Diego has been making its rounds on the internet ever since the study was first published in the Nature science journal last week.
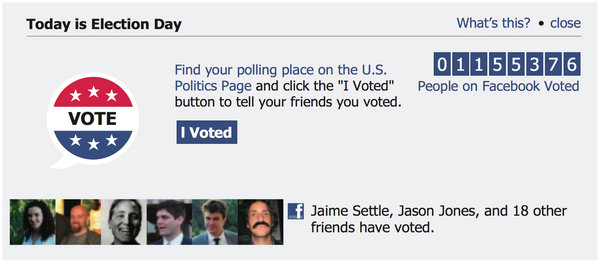
You've probably seen the above image of Facebook's nonpartisan "Get Out the Vote" message. And if you remember seeing the message on the last Election Day, then according to Fowler's findings, you could be one of the 340,000 voters that went to the polls as a result of seeing photos of friends who had voted.
If you want to get nerdy, here are the details of the study: a randomized controlled trial of about 61 million Facebook users received the message during the 2010 US congressional elections. The message also provided a link to the nearest polling station and a button that said "I Voted". In order to conduct the study, the researchers used two control groups of about 600,000 people. While one group saw no message, the other group was encouraged to vote but without the social pressure markers such as photos of friends, or reminders that "Tim Natividad and 41 other friends" have done their democratic duty.
The study was the first of its kind to prove that social networks have strong influence over elections. More significantly, and equally less surprising, is that "strong ties", as opposed to "weak ties" on social networks like Facebook were the only ones that mattered in respect to votes gained by social influence. Fowler argues that just as in real life, our friends online affect the decisions we make:
"There has been a lot of interest in how real-world behaviors affect other real-world behaviors. What we have shown here is that those two worlds are not separate: the online world and the real world affect one another. And in this case, we find that this message that started online, that spread online, actually affected real-world behavior. It got a third of a million people to the polls."
While Fowler's study formally proves the influence social networks can have on our world realities, the idea that online and offline identities are converging has been a point of discussion for some time now. One of my friends (who is incidentally a current Thiel Fellow) Dylan Field likes to describe this convergence as the "data identity narrative".
Dylan argues that there is so much information and data in our world that individuals can only process that data through the lens of their identities. This is, in a way, another definition of subjectivity. Layered on top of this identity driven data digestion are the narratives we construct by parsing through all the data we experience day in and day out. Much like Fowler, Dylan argues that the same process of offline data identity narrative construction is taking place online: Facebook receives data, parses through that data based on the user's online identity, and then serves a narrative which we like to call our Facebook News Feeds.
But more importantly, Dylan argues that online and offline data identity narratives are constructed together, that they are related feedback loops. He explains it by positioning the narrative created by Facebook as the data that begins our offline data identity narrative process. So in this multi-layered process, our Facebook News Feeds, which are the narratives constructed online, end up being part of the data we take in when we construct our offline identities.

Even before Fowler's study and Dylan's proposed data identity narrative, the importance of social influence has been around as early as the 1980s when British anthropologist Robin Dunbar first proposed the idea of a suggested cognitive limit to the number of people with whom one can maintain stable social relationships. This limit, he argued, was around 150 people (and is now commonly referred to as Dunbar's Number).
Dunbar's study initially set out to better understand why human brain sizes were so much larger than any other animals. The resulting answer was that animals with bigger brains had larger and more complex social networks, with humans having the largest of all. While it was later concluded that Dunbar's Number is strongly correlated to frontal cortex size it is also said today that the frontal cortex size is the most distinct evolutionary advantage for humans.
